| Figure 10 |
 |
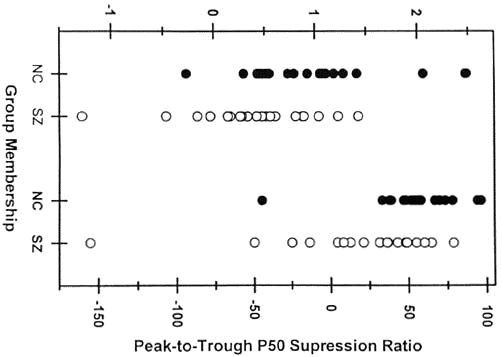
| Comparison of normals (NC) and schizophrenics (SZ) on the P50 auditory gating paradigm. The ratio of the decrease in the test wave amplitude to the conditioning wave amplitude (right) discriminated between the groups better than the difference between the waves (left). Other studies, e.g., Figure 8, used the ratio of the test to the condition wave; the value reported in this figure is equal to 1 minus the ratio of the test to the conditioning wave. (From ref. 22) |
| Back to Chapter |
published 2000