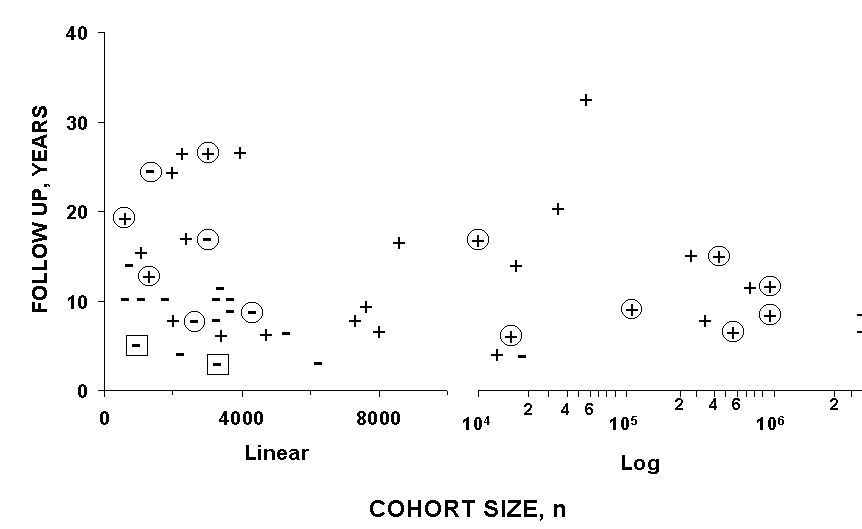
| Figure 10. |
 |
| Cohort size and follow up period in relation to 40 employee, community, or random population studies finding (+) or not finding (-) a positive relationship between obesity and mortality. Encircled signs represent female cohorts and squares around signs indicate that men and women were analyzed together. For layout reasons seven cohorts have been plotted in positions deviating as little as possible from the true values. Signs for cohort sizes increasing from 0 to 5,000 in the follow-up interval 1-10 y correspond to references 11 (men plus women combined), 12-15, 16 (men and women), 17-19 (men plus women combined, unpublished SOS mortality data, see 7 pages ahead), 20-22 (men and women, and 23 (urban and rural). Signs for cohort sizes increasing from 0 to 5,000 in the follow-up interval 11-20 y correspond to references 24 (women), 25-27 (women), 28 (black men and women), and 29. Signs for cohort sizes increasing from 0 to 5,000 in the follow-up interval 21-35 y correspond to references 30, 31 (women and men), 32 (men and women), and 33. Signs for cohort sizes increasing from 5,000 to 10,000 corresponds to references 34-38. Signs for cohort sizes increasing from 10,000 to 100,000 correspond to references 39, 38 (women), 40 (women), and 41-44. Signs for cohort sizes increasing from 100,000 to 4,000,000 correspond to references 45 (women), 46, 47, 46 (women), 3 (women), 48 (men and women), 2 (women and men), and 3. References without comments refer to studies in men. |
published 2000