| FIG. 1 |
 |
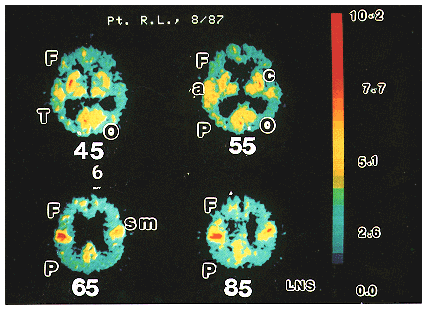
| PET scans of a severely demented AD patient. rCMRglc, derived with Scanditronix PC 1024-7B tomograph, in units of mg/100 g brain/min. Higher metabolic rates are retained in the primary sensorimotor cortex (sm), primary visual cortex (o), primary auditory cortex (a), and caudate and lenticular nuclei (c), but are reduced in association neocortices. P, parietal lobe; F, frontal cortex; T, temporal cortex; O, occipital cortex. Numbers represent millimeters above inferior orbitomeatal line. (Courtesy of Laboratory of Neurosciences, National Institute of Aging.) |
| Back to Chapter |
published 2000