| Figure 2 |
|
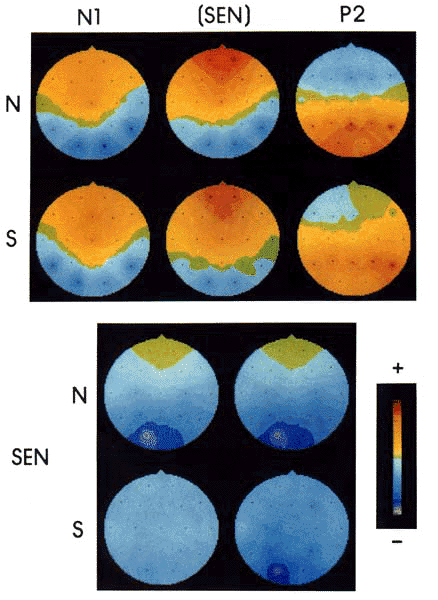
| Top figure shows topographic field maps for the group mean Span ERP data computed at the peak latency for the N1 (left), Span elicited negativity (SEN; middle), and P2 (right). Normal children (N) are presented above schizophrenic children (S). Peak latencies, relative to Span stimulus onset, were obtained from the group mean wave forms (N: 195, 250 and 343 msec; S: 199, 226 and 324 msec). Color voltage scale:: green = 0 V, red = 11 mV positive, and lavender = 11 mV negative relative to a linked ear reference. Recording electrode locations are indicated by black dots. Bottom figure shows topographic field maps for the group mean difference potentials computed at SEN peak latency as in the middle column above. On the left, maps are at the same gain as above (+ 11 mV full scale) for both the normal (top) and schizophrenic (bottom) children. On the right the same scale is used for the normal children. For the schizophrenic children's map, the gain has been increased (+ 6 mV full scale), eliminating amplitude differences so that the field topographies can be more easily compared. (From ref. 104, with permission.) |
| Back to Chapter |
published 2000