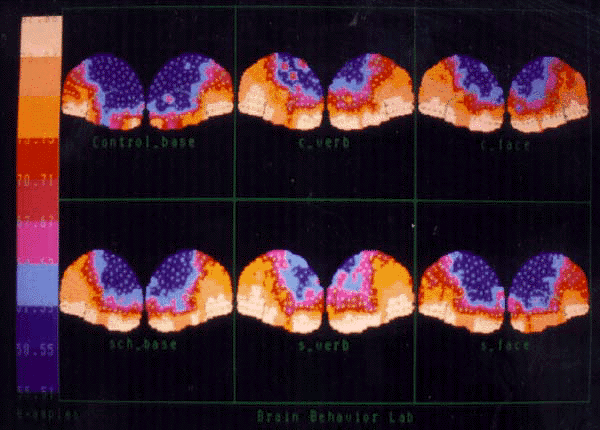
Regional cerebral blood flow in two hemispheres of schizophrenics and matched controls when resting (R), solving verbal analogies (V), and performing spatial task (S). Normal control values are from earlier study for comparison with latest matched sample. A color-coded topographic display of the raw rCBF values in healthy controls (upper row) and patients with schizophrenia (lower row) for resting baseline (left column), verbal memory (middle column) and facial memory (right column). The color scale on the left shows the relative magnitude of values. Note the high flows anteriorly and in the visual cortex, and the overall increase during memory activation. (Reprinted from ref. 42)