| Figure 18 |
 |
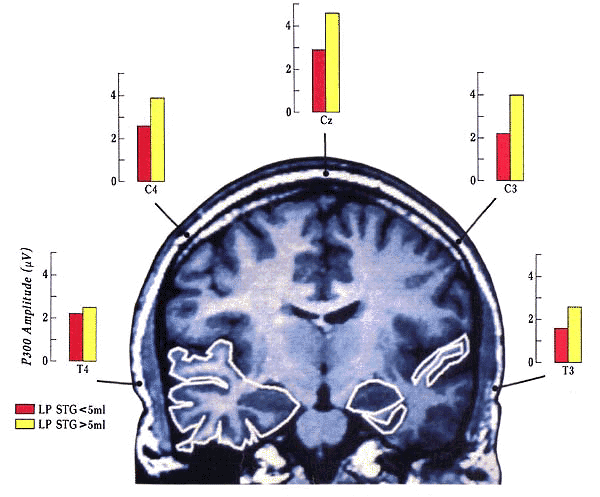
| Magnetic resonance image showing temporal lobe (outlined on left portion of figure) and hippocampus, superior temporal gyrus, and parahippocampal gyrus (outlined separately on right portion of figure). The P300 amplitudes have markedly decreased left temporal (T3) voltages in those subjects (shown in red) with lower superior temporal gyrus volumes. (From ref. 68) |
| Back to Chapter |
published 2000