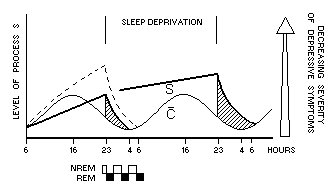
The two-process model of sleep regulation and its application to depression and sleep deprivation response. Process C (the circadian pacemaker) and process S (the homeostatic component) in a healthy subject (dotted curve) and in a depressive patient (continuous curve) plotted for a regular sleep–wake cycle followed by total sleep deprivation. The sleep periods of the depressive patient are indicated by shading. Due to the deficiency of Process S, sleep propensity and the amount of slow-wave sleep are reduced, and the sleep period shortened. The deficiency of Process S leads to disinhibition of the REM sleep controlling process in the first part of sleep. Consequently, the latency to the first REM sleep periods is shortened and its duration increased (black and white rectangles represent the REM–non-REM cycles). Sleep deprivation normalizes not only the depressive sleep architecture, but induces a remission of depressive symptomatology (arrow on right ordinate). Reprinted with permission from ref. 5.