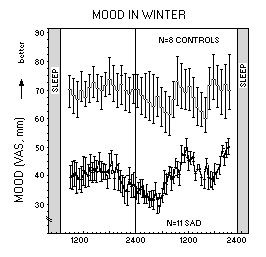
| FIG. 3 |
 |
| Circadian rhythm of half-hourly self-ratings of mood (Visual Analogue Scale, VAS, mean ± sem): 0 mm = extremely depressed mood; 50 mm = euthymia; 100 mm = extremely good mood) throughout a total sleep deprivation during a 40-hr constant routine protocol (see ref. 74 . The subjects slept in the laboratory before and after the constant routine. The vertical line is anchored at midnight. Two groups of women were studied in winter, in the follicular phase of their menstrual cycle, when present: patients diagnosed as SAD, N = 11, aged 46.5 ± 3.9 years (Hamilton Depression Scale score = 13.9 ± 1.5) and matched nondepressed controls, N = 8, aged 50.4 ± 4.4 years. ANOVA for repeated measures was carried out using 1.5 hourly averages. This showed that (a) controls had higher mood ratings than SAD {F(1,17) = 58.6, p = 0.0001.}; (b) both groups showed a circadian rhythm {F(23,391) = 2.8, p = 0.0001.}; (c) the time course of mood change was different in the two groups. SAD showed a mood improvement with sleep deprivation, controls rather a decline: {interaction term F(23,391) = 1.7, p = 0.026.} (Wirz-Justice et al., unpublished data). |
| Back to Chapter |
published 2000