| FIG. 5 |
 |
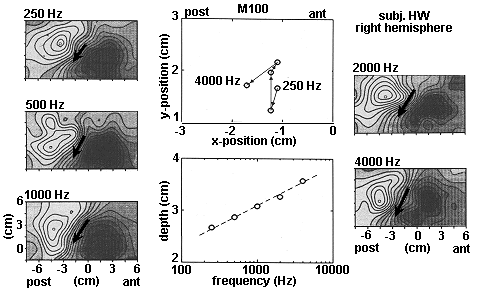
| Isofield right hemisphere ERF plots at a latency of 88 msec for four tone pitches in a left-handed subject. 500-msec, 60-dB HL tones were presented to the left ear at 4-sec intervals. Field strength is encoded with a gray scale (dark, outgoing flux; light, ingoing flux). In the middle column are the positions of the current dipoles associated with each tone. The dark arrow indicates the location and orientation of the current dipoles, their length proportional to the dipole moment. The origin of the coordinate system is T4. From Pantev et al. (50). |
| Back to Chapter |
published 2000