| FIG. 2 |
 |
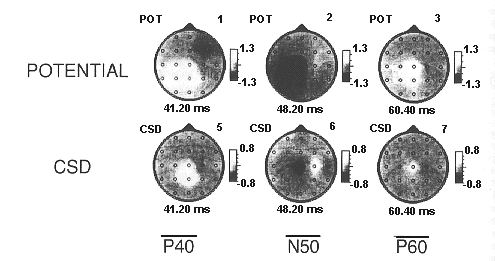
| Potential (voltage) and current source density (CSD) maps of the somatosensory evoked response (SER) following left (lt) tibial nerve (N) stimulation. Data are based on averages of responses to 500 to 1,000 electrical stimuli delivered at a rate of 2.1/sec to a healthy man. Maps are given for P40, N50, and P60 components (P or N signify positive and negative, and the number is the mean peak latency in msec). Lighter shading is more positive. Note that localization of components is better in CSD maps than in potential maps. Adapted from Nagamine et al. (46). |
| Back to Chapter |
published 2000