| FIG. 9 |
|
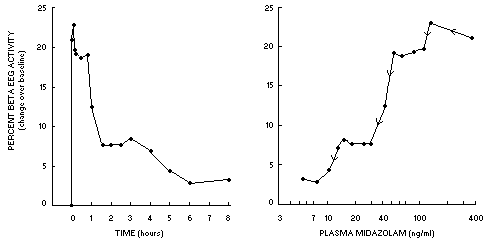
| Left: For the subject referred to in Figure 2 and Fig. 3, the EEG was monitored prior to and for 8 hr after the intravenous dose of midazolam. The EEG signal was analyzed by computer to determine the relative activity in the 1330 cps range, also termed the beta range. The maximum EEG change was not attained immediately after the end of the infusion, but rather at five minutes after completion of the infusion. Right: A plot of plasma midazolam concentrations (x axis, logarithmic scale) versus EEG change (y axis) shows that the maximum EEG change does not correspond to the maximum plasma concentration. Arrows indicate the direction of increasing time. |
| Back to Chapter |
published 2000