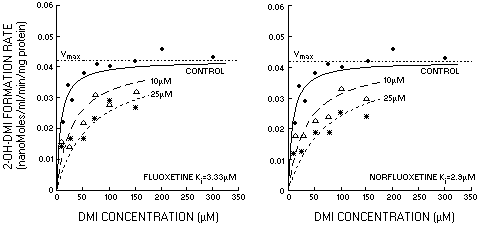
| FIG. 7 |
 |
| Rates of formation of 2-OH-DMI following incubation of human liver microsomes with varying concentrations of desipramine (DMI). Closed circles represent reaction velocities in the control condition, with no inhibitors added. The other points represent reaction rates with coaddition of 10 mM or 25 mM of fluoxetine (FLU), left, or norfluoxetine (NOR), right. Lines were determined by fitting of Eq. 5 to the data points by nonlinear least-squares regression. The resultant Ki values were 3.33 mM for fluoxetine and 2.90 mM for norfluoxetine. |
| Back to Chapter |
published 2000