| Figure 7 |
 |
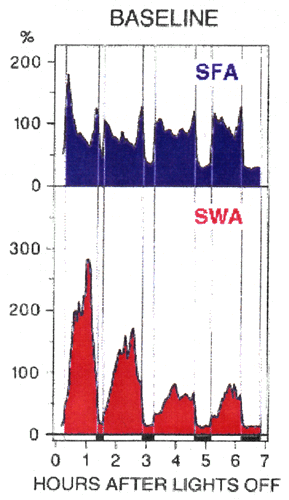
| Time course of slow-wave activity (SWA) and spindle frequency activity (SFA) during a night-time sleep episode (n=8). The nonREM sleep episodes were subdivided into 20 equal parts, the REM sleep episodes into five equal parts. The time axis represents the mean onset and offset times of the episodes. The values are expressed for each individual relative to the mean nonREM sleep level (100%). REM sleep is delimited by vertical lines and horizontal black bars above the abscissa. The colors correspond to the frequency ranges marked in Figure 5. (Adapted from ref. 24) |
| Back to Chapter |
published 2000