| Figure 10 |
 |
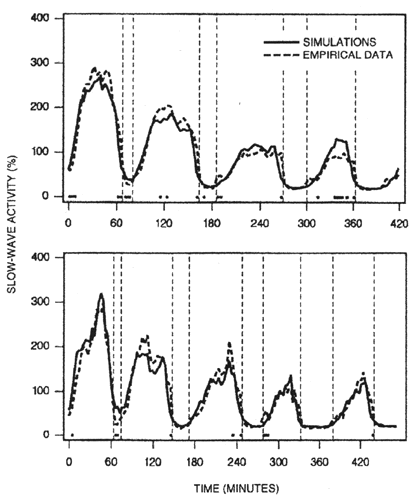
| Simulation of the time course of slow-wave activity (SWA). The curves represent mean values of empirical and simulated SWA). Top panel: baseline nights used for parameter estimation (n=16); bottom panel: independent data set which had not been used for parameter estimation (n=8). Simulations were performed on an individual basis. SWA (data and simulations) was standardized with respect to mean SWA in the first 7 h of nonREM and REM sleep. The nonREM sleep episodes were subdivided into 20 equal parts, the REM sleep episodes into five equal parts. The curves represent mean values over subjects for each part and are plotted according to the average timing of the episodes. Significant differences between data and simulations are indicated by black marks above the abscissa (p<0.05; paired t-test). (Adapted from ref. 2) |
| Back to Chapter |
published 2000