| Figure 3. |
|
|
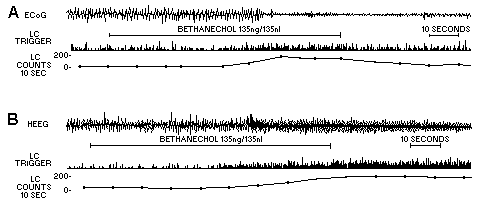
| Relationship of LC activity to cortical (ECoG; A) and hippocampal EEG (HEEG; B) before, during, and after peri-LC bethanechol infusions. A and B represent data from separate experiments. In each experiment, bethanechol-induced changes in EEG activity were observed simultaneously in both the ECoG and HEEG recordings. Bethanechol was infused at a constant rate throughout the interval indicated. EEG activity is shown in the top trace of each panel, the raw trigger output from LC activity is shown in the middle trace, and the integrated trigger output (10-sec intervals) is shown in the bottom trace. In A, LC activity is seen to increase during the latter part of the infusion; several seconds later, reduced amplitude and increased frequency become evident in the ECoG trace. As LC activity begins to decrease following the infusion, ECoG amplitude begins to increase and its frequency decreases. In B, enhanced LC activity becomes evident in the latter part of the infusion period; several seconds later, theta rhythm begins to dominate the HEEG trace. For the remainder of the trace, LC activity remains elevated and theta rhythm predominates. (From ref. 15.) |
published 2000