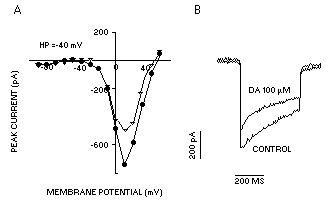
| Figure 2. |
 |
| Illustration of DA-induced inhibition of IL in cultured mesencephalic DA neurons. A: Whole-cell current traces showing IL before (•, Control) and after the local application of DA (D, DA 100 mM). The membrane was held at -40 mV and stepped to a potential of 10 mV. B: The current–voltage relationship for the cell shown in A. |
published 2000