| Figure 7. |
 |
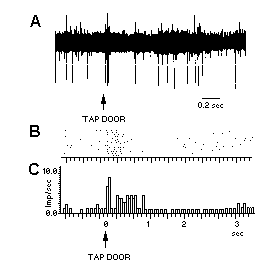
| A: Slow-speed recording from an LC neuron in a waking, chair-restrained monkey in response to a single tap on the door of the experimental chamber (at arrow). Note the stable spike size, and the phasic activation followed by post-activation inhibition, typical of LC (and other) neurons. B: Raster display of activity of this same LC neuron in response to a series of door taps (at arrow below panel C). Each dot represents an impulse from this neuron, and activity for 13 trials is arranged in rows from top to bottom. Note the consistent activation followed by postactivation inhibition for these stimuli. C: A cumulative peri-stimulus time histogram (PSTH) of activity seen in panel B, but summated in one display for all 13 trials. Time base in panel C applies also to panel B. For more details on properties of monkey LC neurons see Foote and Aston-Jones) and ref. 43. |
published 2000